
 Facebook
 X
X
 Pinterest
 Copy Link
This morning while still trying to motivate myself out of bed I was scrolling through the CNN Money headlines on my crackberry when I saw the headline “Home Prices Heading for Triple Dip.”
http://money.cnn.com/2011/10/31/real_estate/home_prices/index.htm?iid=HP_LN
Ah dangit, that’s not a good way for a REALTOR(R) to start his day. But of course I know that there’s always more to the story than a scary headline, it is Halloween after all. As REALTORS(R) we’ve trained our base and a majority of the public that each market is different and what’s happening nationally may not be happening locally. So my next step was to start digging, what’s happening in Missoula and have we even seen this “peak to trough” type of market?
Lots of charts below but first thank God for Paragon 5. It’s ability to sort, filter, and then export to a CSV only took me about 1 hour to put all of the data together and then create these charts.
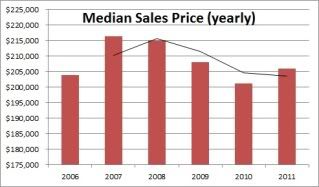
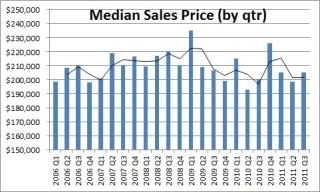
So lets start with the median sales price trends in Missoula, I broke it apart both quarterly and by year, going back to 2006. The chart with quarterly data is quite clearly the one with a ton more bar charts. You’ll see that I added a running average trend-line with the charts as well. As you can see from the yearly data in general we’ve seen just a single dip with a slight value recovery happening this year so far. If you bust it down further though by quarter you begin to see a little more peak and trough action which possibly suggests that 2009 saw a peak and then a fairly steady drop with one exception right until the 3rd quarter of 2010. Since then we saw a bit of a spike and it’s been fairly flat since and if the prior trends suggest anything we’ll probably see another median sales price spike at the start of next year. This could suggest that Missoula’s market is once again weathering the storm better than other major markets.
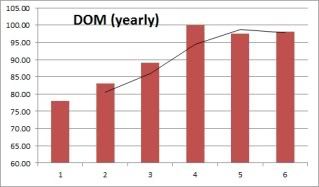
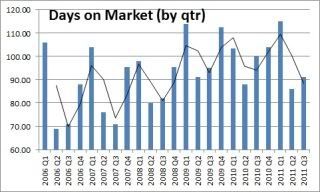
The other thing I thought would be interesting to look at was what we refer to as DOM, aka Days on Market, to see how our market time is doing based upon our sold properties. The charts I put together were once again quarterly and yearly. I’d say for both of these there’s no major surprises, market times are getting longer.
In the quarterly data one might wonder why it’s just the up and down roller coaster, the answer is an easy one. This is Missoula, Montana – our market is impacted by the seasons and we clearly see that every year the winter months extend time on market. Following the running average you can see that on average our DOM has increased by roughly 3 to 4 weeks on market over the course of the last almost 5 years.
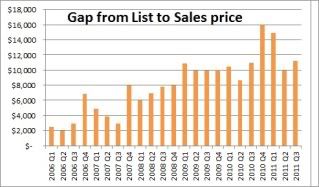
Finally one of the more telling charts, the reported difference between the original listing price and the final sales price. This chart required some extra work and I could’ve made a few of these as well. I decided to just show the one chart that just shows the actual dollar difference between the median list price and median sales price, per quarter. I also calculated the percentage of reduction from the original listing price, as you’ll see in this chart that percentage has grown over the years and is now up to 5%, which is not at peak, the peak was 7% just this time last year. (Meaning that in the 4th qtr of last year houses came down on average of 7% off their original listing price to get sold).
So here’s what I’m watching this 4th quarter:
1. The median sales price. Historically in Missoula our median sales finish fairly high in the 4th quarter and in the 1st quarter. The reason why of late has circled around the timing and activity of first time home buyers and the impact on the availability of funds for financing.
2. The final volume of the year. Missoula is on pace to have it’s lowest volume in sales in over a decade, conventional thoughts suggested that between 800 – 900 units per year was Missoula’s “sustainable” number but this year we’re on pace for 750, which would be down another 80 units from 2010.
3. Foreclosure sales. I’d reported in the past that Missoula’s foreclosure sales only accounted for about 19% of our sold activity but as we’re seeing all over there’s more foreclosure listings entering our market. These lower priced units will affect values negatively however it could spur increased activity.
Lots of interesting things to watch ahead, we’re seeing some small value gains but our activity is still scaling back. Additionally we can now compare “normal” markets so a more accurate measure of our market health will begin to come about now.
